July 6th, 2021
The Big Data Landscape Revisited
By GilPress
Bruce Reading, CEO of VoltDB, has an interesting and original take on the big data landscape.
Last year, Dave Feinleib published the Big Data Landscape, “to organize this rapidly growing technology sector.” One prominent data scientist told me “it’s just a bunch of logos on a slide,” but it has become a popular reference point for categorizing the different players in this bustling market. Sqrrl, a big data start-up, published recently its own version of Feinleib’s chart, its “take on the big data ecosystem.” Sqrrl’s eleven big data “buckets” are somewhat different from Feinleib’s, demonstrating a lack of agreement, understandable at this stage, on what exactly are the different segments of the big data market and what to call them. Furthermore, Sqrrl positions itself “at the intersection of four of these boxes” which raises questions about the accuracy of its positioning of other big data companies inside just one or two boxes.
Another interesting recent attempt to make sense of the big data landscape comes from The 451’s Matt Aslett in the form of a “Database Landscape Map.” Taking its inspiration from the map of the London Underground and a content technology map from the Real Story Group, it charts the links between an ever-expanding database market and the data storing/organizing/mining technologies and tools (Hadoop, NoSQL, NewSQL…) that now form the core of the big data market.
Which brings me to Bruce Reading, VoltDB, and their take on the big data landscape. “It’s a very noisy market,” Bruce told a packed room at a recent VoltDB event. “It’s like shopping in a mall at Christmas time when there’s a lot of noise and a lot of information about a lot of technologies. We are trying to work with the marketplace to understand what you are trying to accomplish. Instead of using market maps based on technologies, we are looking at use cases.”
“Use case” is technology-speak for the list of requirements for achieving a specific goal, requirements that are embodied in the software that allows the user to achieve that goal. In other words, specialized software focused on addressing some unique need. VoltDB is focused on time (or data velocity) and believes, to quote Bruce, that “the whole world is trying to get as close to real-time as possible because that’s where the greatest value is of a single point of data.” Or, in the words of VoltDB’s website, companies are “devising new ways to identify and act on fast-moving, valuable data,” and VoltDB helps them “narrow the ‘ingestion-to-decision’ gap from minutes, or even hours, to milliseconds.” Which is why they see the “Data Value Chain” like this: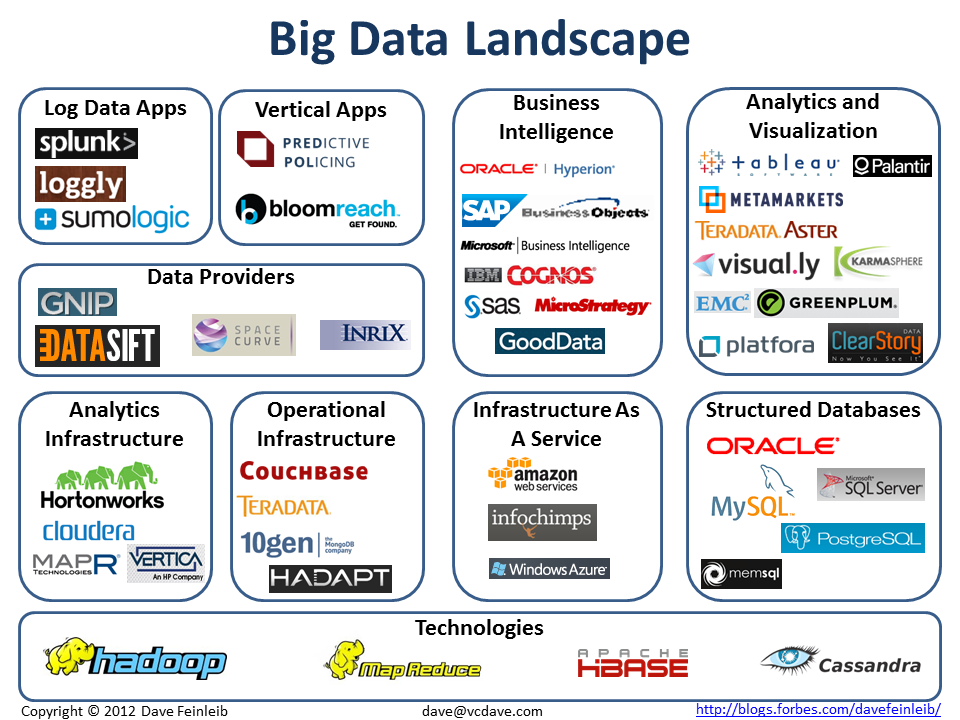
And describe the “Database Universe” like this:
This is the first attempt I’ve seen to map big data technologies based on what these technologies are trying to achieve and the type of data involved–is it unique (an individual item) or is it a part of a collection of data?–along three dimensions: Time, the value of the data, and application complexity.
The insight behind these charts is that the value of an individual piece of data goes down with time and the value of a collection of data goes up with time. Maybe this should be called “Stonebraker Law.” Mike Stonebraker is the database legend (forty years and counting) behind VoltDB and other big data startups. You can watch him, Bruce, and John Piekos, VoltDB’s VP of Engineering, here.
[Originally published on Forbes.com]
Last updated on January 27th, 2025.
More from Big Data Analytics